I wasn’t going to blog about performance until a later post, but there was a performance issue I wanted to tackle before discussing some other things.
The frame rate sometimes seemed to be as expected, but sometimes slow, and the application was quite unresponsive when handling the Stop button command.
To help nail this down I created a Buffer Frame Rate performance counter, so that I monitor it along with another couple of metrics (I chose to see the count of gen1 and gen2 garbage collections, along with the % time in GC, and % processor time).
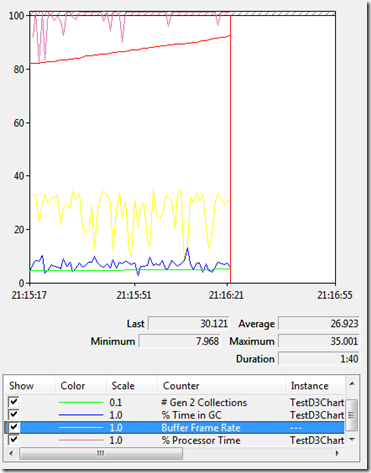
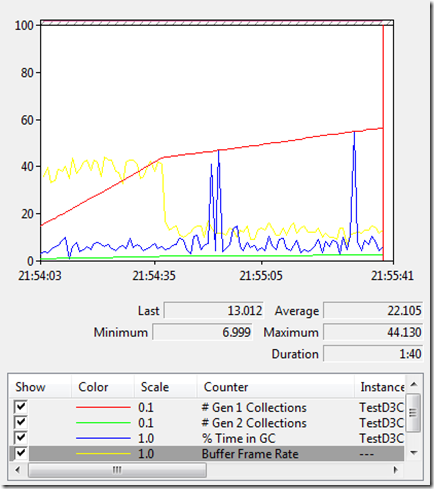
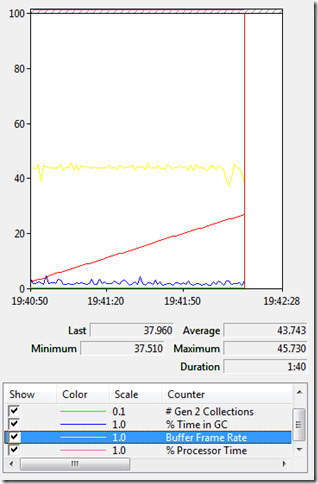


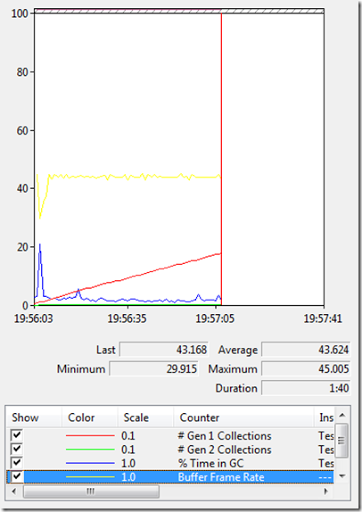

The rate of gen 1 collections is lower still than previous, but the profiler shows that app is still spending the majority of its time in drawing the charts. Surprisingly the CPU usage doesn’t seem to have dropped much, although in the profiler the time can now be seen to be split between the drawing of the two charts, instead of dominated by the drawing of the sliding window chart.
The micro-optimisations were still worth investigating, as I have charts in mind that will draw multiple traces simultaneously.